This is a set of rules/notes I keep on my computer:
Futures
Rule #1: Charts and Market Signals dictate direction.
Rule #2: TRADE PATTERNS BASED ON HIGHER TIMEFRAME SUP/RES. AREAS
Rule #3: Take a break middle of day
Rule #4: Wait for it.
Rule #5: FOCUS ON STRENGTH, GO WITH FLOW.
Rule $6: morning 10:30 and 3:15 key times
Rule #7: Only focus on 1 market: /tf
BEAR MARKET: shorting tops -- always higher probability. Market
oversold: enter on double/triple top bounces - at major support only.
RANGEBOUND: set limits to catch tails at 3 touch horizontal support lines
OVERSOLD: Wait for HIGH VOL. PUKE CANDLE. watch for breakout of channel for major rip... <-- entry long.
OVERBOUGHT: need to see BLOWOFF CANDLE and TL down before entry. TRIPLE TOPS
BULLTARD WEDGE B/O: Only in direction of market. Tight stop entry.
Patterns:
1: triple tops bottom at clear sup/res: Check Higher Timeframe for double confirmation. PLUS: must see divergent signals
2. Sharp Trend leading to break and small double bottom - enter b/o
3. Enter breakouts in wedges on Trend Days
Finally: I don't discuss exits much... but using 5-minute candles or even higher helps finds larger trendlines which often act as support / resistance. Whenever it's unclear, keep looking at a higher timeframe. Sometimes the market will just chop around because a clear support or resistance area hasn't been established. Once it is, you can use that area to find an entry.
Saturday, March 31, 2012
Friday, March 30, 2012
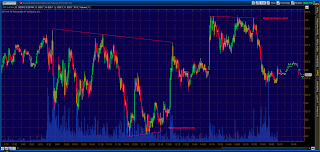
triple top: bottom VOLUME BLOWOFF

The top was fast -- the big triple top completed just as the bell rung at 9:30 -- and then it was 100 ticks down. Not bad.
Today's learning lesson is how to get back in. First -- we need to see big PUKE candles which is the big stops being taken out. There were several.
But that's not enough. Finally, the trendline broke and that would be the first time to enter - and as it turned out... the market rallied back 60 ticks...
Knowing it was Friday, end of quarter, and the Market Signals were not bad (xhb, xlf, iyt, slv) -- there was no doubt a small rally would ensue.
So when trying to catch a bottom -- the key is looking for big volume blowoff candles and then a bit of stability -- or simply take a first stab as the trendline breaks. The key thing is -- do not try to enter early -- you just set yourself up for failure -- and will end up getting caught in the PUKE moment.
You enter as the order flow changes and then wait for the next resistance area to be established and reverse.
Thursday, March 29, 2012
Major Time Frames

I actually saw the triple bottom as it happened -- sort of. Not really. I was wrong but then it resolved a few minutes later.
What I learned today was -- I should have been switching back to the 5 min. candles and realized going into Friday, eoq -- (I was thinking about this ) - the market could easily run back into the descending trendline -- not changing the structure -- but it was a 100 tick run from the triple bottom. There was every reason to take a chance and hold with a rising stop.
/gc did a similar move -- after getting crushed -- it ran all the way back up to form a triple top -- easily seen with 5 min candles.
And furthermore -- the triple bottom on /tf today was very tradeable as it was just past a nice round number, 820. Notice it essentially ran to 830. /tf loves round numbers.
The Market Signals were keeping me too cautious. Market signals were saying trend down day - but I think I also learned -- give the CHARTS priority. Charts were saying up we go and only at the end of day did a few markets like gold and silver turn green. You don't need to wait for it. You do need to wait for the chart patterns but after that... you just follow the charts...
Much of everything else - news, your thoughts/opinions are noise. Filter out the noise. It will help a lot.
Wednesday, March 28, 2012
FOCUS
Must focus on /tf only for futures trading -- otherwise will never get to CP.
The same patterns are emerging over and over. Triple bottoms, Double bottoms, wedge b/o and retests.
Mornings and 3:15 are the times to watch for but looking for large moves on large patterns and small moves on small patterns is all that's necessary 1 or 2 good trades a day.

This is simple stuff but doing it requires the patience and discipline of a strong person.
Tuesday, March 27, 2012
waiting for key time - breaks

But then 3:15 -- we know funds enter and the break lead to a super trade with no heat. Waiting for key times during slow/mixed signal market is key.
The only other thing to do was to trade the edges and get 10 or 15 ticks here and there as there was not going to be any big moves until larger players entered end of day.
Monday, March 26, 2012
using MAs
moving avg. lines show you order flow -- so you should be going WITH the lines.
The Market Signals tell you Market Strength.
Today should have been all long, all day... and I was trying to short.
This is not just wrong, it's a complete failure to understand what futures trading is all about...
strong stocks are strong -- Monday, end of month with Bernanke QEIII talk -- there's not even a shade of weakness.
Must be one kind of trader and not another. Flow trader goes with flow. Either follow the signals or do not trade.
Making it too hard today with all kinds of thinking. Thinking is ruining the trading process.
Observation and acceptance will outperform every day.
You know what's strong. Buy it. You know what's weak -- don't buy it.

Friday, March 23, 2012
wrong:
market drops at the open -- IBD list weak...
tf hits new lows but XLF is green - and then rallies 60 ticks -- not on board even after the TL break.
Gotta think contrarian.
oil and coals and XLF were all suggesting a bounce despite the obvious weakness.
LESSON: MUST PAY ATTENTION TO DIVERGENT SIGNALS -- they matter most.
tf hits new lows but XLF is green - and then rallies 60 ticks -- not on board even after the TL break.
Gotta think contrarian.
oil and coals and XLF were all suggesting a bounce despite the obvious weakness.
LESSON: MUST PAY ATTENTION TO DIVERGENT SIGNALS -- they matter most.
Thursday, March 22, 2012
it will be there if u wait
waited all day impatiently and then the triple top resolved -- almost stopped out -- and then I called the bottom to the tick... the pattern resolved.
There is no way to be profitable except to determine support/resistance and then trade when the patterns resolve at those levels -- using Market Signals to determine strength.
Attempting to buy weakness is disastrous as always.
Strong momo names are strong and that's what will work. The /gc also worked but it tends to break patterns -- run stops.
 By determining the resistance / support lines -- one can safely enter. And even the failures will be small so that the winners can overcome the losses. But there are only 2 or 3 trades max per day so patience is required.
There is no way to be profitable except to determine support/resistance and then trade when the patterns resolve at those levels -- using Market Signals to determine strength.
Attempting to buy weakness is disastrous as always.
Strong momo names are strong and that's what will work. The /gc also worked but it tends to break patterns -- run stops.

Wednesday, March 21, 2012
wait for it...
managed to get to profitable -- foolish to trade with no volume, no set ups... actually had a huge day.
missed a clear triple bottom - tf -- for 30
then got with /cl short...
The patterns are just to help you. /tf was clearly resistant at 830ish.
The Market Signals were mostly strong but TLT was strong and XLF weak -- setting up for a chop day.
Today was not a great day - -in fact, it was as difficult as it could be and I actually did fine.
Main lessons: WAIT for clarity. The trade will call to you. Your job is to NOT THINK. Observe and then you'll see the resistance/support unfold.
THINKING just adds clutter.
Tuesday, March 20, 2012
where support is?
How do you know a support area IS a support area?
1) It's bounced there recently -- up or down.
2) It forms a clear pattern.
The pattern is either a double top/bottom or more powerfully - the symmetrical triple bottom -- which almost always ensures a big move.
The move is dictated by:
a) time between the touches
b) volume during the pattern
c) Market Signals
d) sector strength
for /es or /cl -- these broad patterns often resolve before turning points... always after extended moves.
The trend having been established... the market then proceeds to either run dramatically or create minor patterns -- pennants/flags/wedges
until it reaches a new resistance area. This too will often resolve through a double or triple top -- unless the area has been clearly touched before in which case there's no need.
Today's bottom in /tf was clearly marked by a triple bottom before a fast move and then triple top ended it... bounced again... and a higher triple top began a move down.
This bread and butter pattern should be the basis for ALL entries -- with add-ons after the intial direction goes the intended way.

Thursday, March 15, 2012
/gc
today's best trade was clear and obvious -- /gc double bottomed and double bottomed again at a higher level then went into a pennant formation before breaking out -- it then ran 160 ticks in an hour with virtually no pullback.
the market is noise 95% of the time but then it forms clear and discernible patterns which you can jump on.
When you wait for these Major Patterns
1) triple bottoms
2) symmetrical wedges near support/oversold markets
3) double bottoms
The results are fast and reliable.
The Market Signals dictate direction. You watch for the pattern. It is simple and elegant if you don't let your mind get in the way.
Wednesday, March 14, 2012
major structures:
at 10:09 /tf completes a triple top at previous resistance with clear bearish Market Signals -- a TL break leads to 70 tick drop almost straight down.
Later in the day /es forms a tilted 3 top -- and also drops fast and easy.
Finally /gc -- trends down all day but KEY POINT:
Watch for reversal at 3:15ish -- /gc was DEEPLY DEEPLY oversold at a value area and was ripe for a bounce despite weak market signals --- /gc bounced 100 ticks from 3:15 on a clear TL break.
So key learning point: watch the afternoon carefully if market gets too oversold -- watch for TL break bounces.
/es overnight:
3 bump pattern failed --
Huge strength yesterday.
/ES -- often double-tops / bottoms and that's what happened this morning along with /tf.
On strength -- look for /ES double-topping as opposed to slow 3 bump.
Huge strength yesterday.
/ES -- often double-tops / bottoms and that's what happened this morning along with /tf.
On strength -- look for /ES double-topping as opposed to slow 3 bump.
Tuesday, March 13, 2012
major patterns:
major patterns -- Usually 3 bumps descending -- spaced out over 2 or 3 hours -- occur once or twice a day and result in major moves.
Trading futures should be looking for the pocket aces patterns that produce the oversized moves.
Seeking tops/bottoms is fools' game since the market could take hours or days before it actually falls.
Seeking the PATTERN is the answer -- will result in worse entry but better results in terms of heat and time.
Find the pattern, and you've mastered the game. Being early or late -- the pressure to 'try something' is what takes out lesser traders.
You can only trade THE PATTERN.
Every other path leads to failure.
Friday, March 9, 2012
still failing:
so which part of 'setup' don't you get?
If you want to short /tf -- you don't try to 'nail the top'
You wait for the STRUCTURE -- a high vol. candle at resistance
AND
consolidation with a discernible trendline lower 3 touch....
AND
Some sort of confirmation from other markets...
This type of pattern typically takes an hour at least -- same for a long setup.
Jumping in early is a loser.
PATIENCE is the key. You KNOW what to do. Can you WAIT for it?
And then PULL the trigger.
It's about a setup. And the best ones happen at resistance after the early shorts/longs get ripped.
Thursday, March 8, 2012
all my troubles:
stem from not placing stops...
general daily chart swing rule:
1) find supportive area for a known stock with good fundamentals.
2) buy break of downtrend line using 15 min candles.. tight stop.
Will lose small on some, big on the runners.
general daily chart swing rule:
1) find supportive area for a known stock with good fundamentals.
2) buy break of downtrend line using 15 min candles.. tight stop.
Will lose small on some, big on the runners.
failure: market signals
shorted /cl -- on perfect set up and it failed.
why? market signals are trend up -- and major bullish signals will trump a short signal. obviously.
So don't bother looking for shorts in a trend up signal market.
also: the /ng trade was set too tight (by one tick) -- and there was no volume anyway -- in the weakest market -- no way you should be long.
buy pullbacks of STRONG markets. Don't be afraid.
And know key support/res. levels.
And respect market signals.
Wednesday, March 7, 2012
/ng;
a foolish loss.
1: identified 3 touch using 1 min candles.
but that's NOT ENOUGH.
I needed to wait for a consolidation long enough to draw a supportive TL.
/ng fell lower -- THEN consolidated for an hour - and then broke 30 ticks -- from this lower, safer entry.
3 touch is not enough -- especially on bounces.
with the /es touch -- a mini 3 touch TL formed by 20 min. So waiting 20 min. minimum is good idea.
heavy vol: blow off
so often in futures market -- I see a huge 1 min. vol. candle as it blows past a known resistance area into a new level /es 1340 -- blows to 1338.50 on huge vol -- and it's a perfect bottom!
But of course -- when 3 minutes pass and market does not go any lower -- it's obvious those were stop orders blown out -- and the pressure to go lower is exhausted. The market is now full of victorious shorts -- except they have to cover and there's no more buy stops to help them out -- so the bounce occurs.
Waiting for this big volume surge (often on the hour) will clear the way for a high-probability reversal. If the Blow-Off (BO) Candle occurs on a 3 pt. trendline --even stronger.
Tuesday, March 6, 2012
failure /es
attempted to go long triple bottom
- /es weaker than /nq
no confirmation from any markets
- major trend down day signals.
- I should only be shorting resistance today -- 33 under 99.
Bad -- low probability play.
- /es weaker than /nq
no confirmation from any markets
- major trend down day signals.
- I should only be shorting resistance today -- 33 under 99.
Bad -- low probability play.
Monday, March 5, 2012
new system: old system
will be trying to enter CLEAR PATTERNS -- specifically tri-bottoms tops.
elements:
is the market showing relative strength?
is the market oversold at a higher time frame?
are any other markets confirming strength?
is volume drying up in the OPPOSITE direction?
Is there a key level market can run to?
Is it an ideal time of day/month to enter here?
Can you see a clear triple touch trendline?
So the triple touch IS the trade. Must provide some room for wiggle with stops -- particularly with /cl
Friday, March 2, 2012
elements:
33 / 99 day MA -- shows flow
volume: shows power and trend shift
patterns -- trendline touches indicate consolidation in direction of move
ENTER: after top formation (triple top, double top), AFTER formation of 3 bump/consolidation
33 under 99 MA -- ideally: enter on first retest. (unless volume is enormous, in which case there will likely be no retest)
RESISTANCE/SUPPORT areas: most tops/bottoms are on even #s or .50 line.
time of day / time of month: opex days can chop around early.
Market Signals: What other markets are doing? Strong? Weak? Same direction yields best results.
nutshell: identify flow. Enter as the direction consolidates. Buy/sell into support / resistance areas. WAIT for the right entries.
Thursday, March 1, 2012
support and direction
these are the key words.
You want to buy at a support line -- in the DIRECTION of the flow. If you can't determine the trend -- there is nothing to do.
Flow is determined by chart patterns and volume (to indicate power).
Today I detected 2 clear trades but only took one. I did not allow the winner to run. I took bad trades fighting flow and direction because I was BIASED and felt the market had moved too far.
Ha.
All a trader can do is follow a plan. A trend follower trades WITH flow by entering at support areas in the direction of the dominant trend. Other market signals can provide clues. (Are other markets trending in the same direction?)
There is no reason to make any other trade other than the correct one. You'll still get stopped out -- but this is following a clear plan of entry.
Subscribe to:
Posts (Atom)